App Store
4.7 / 5 rating
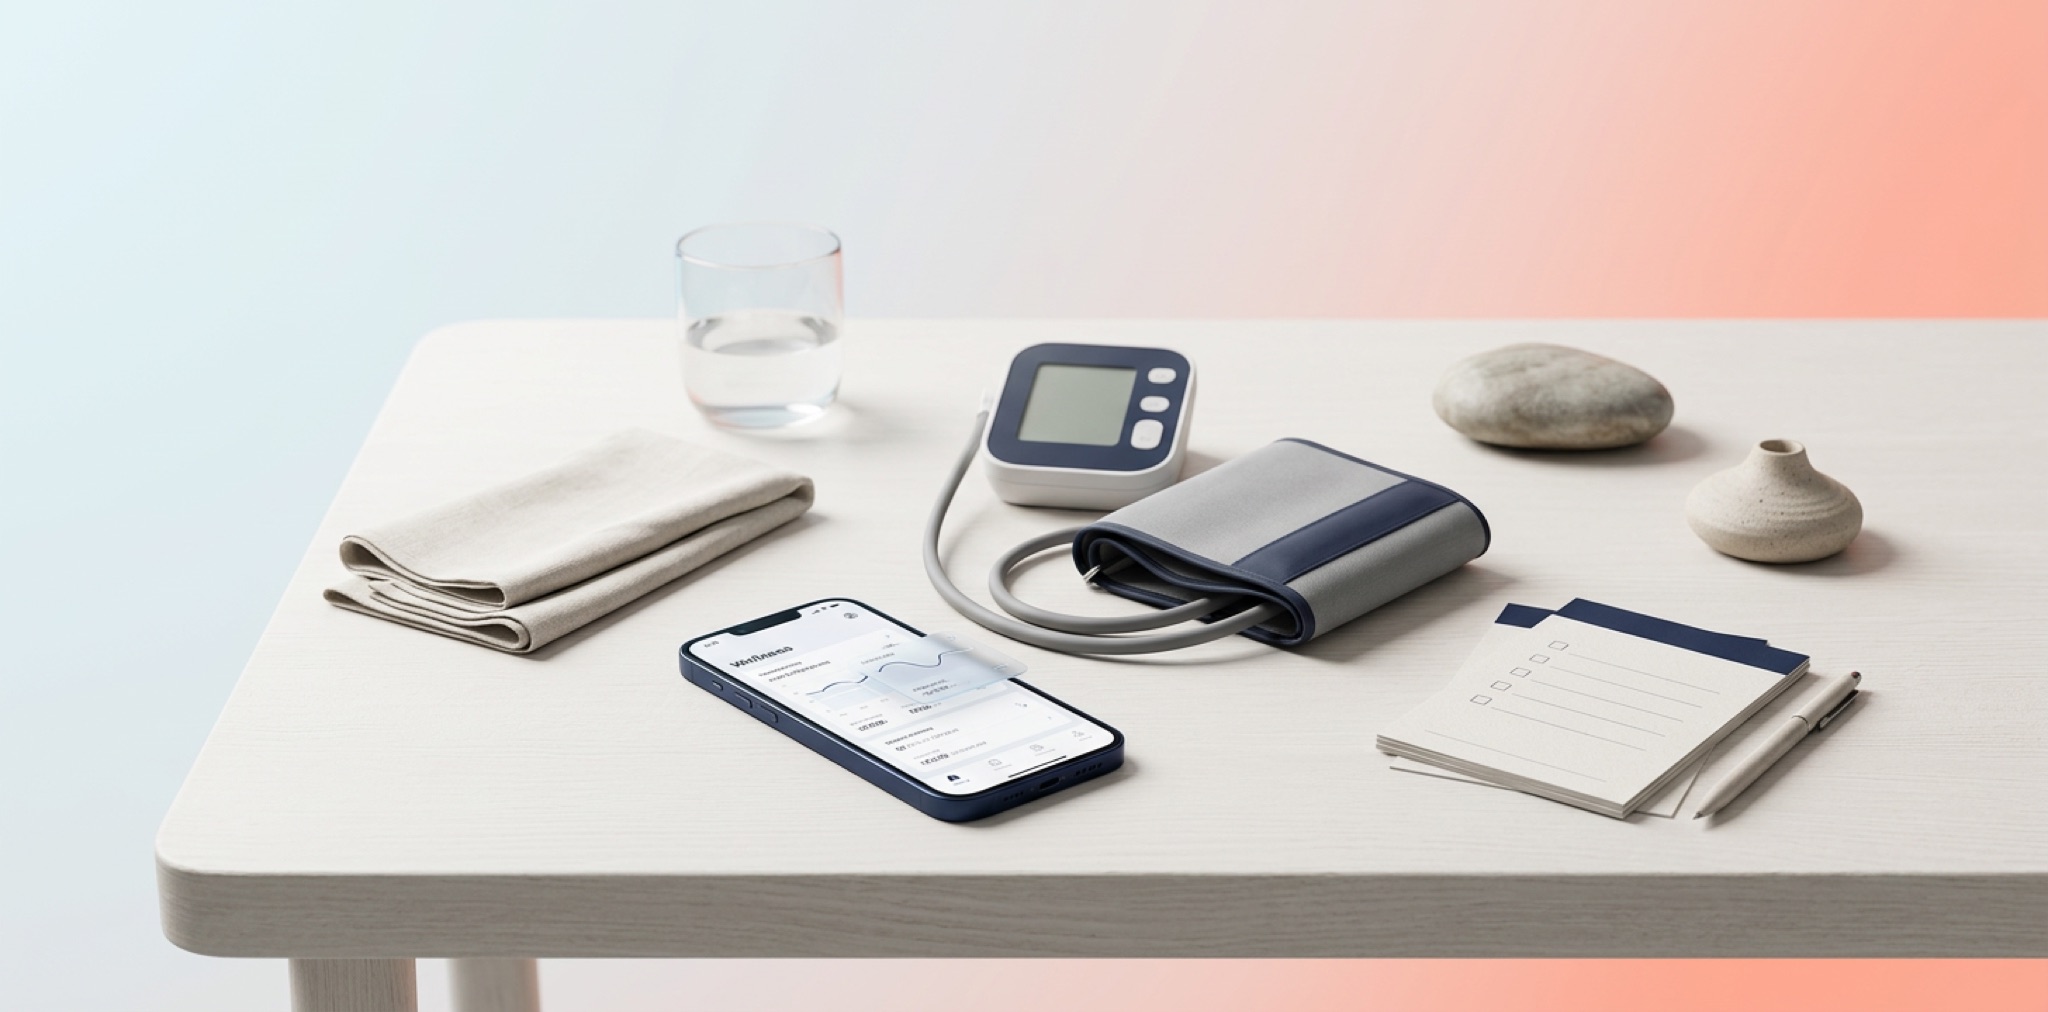
Log blood pressure first, then layer quick pulse context, stress reset, and trend cards. The flow is designed to help you stay consistent week after week.
App Store
4.7 / 5 rating
Category
Health & Fitness
Pulse check
About 30 seconds
Review highlights are summarized from public App Store feedback themes (4.7 rating).
Public feedback
App Store themes
Pulse check
About 30 seconds

“Simple BP logging flow and fast pulse checks in one place.”
Routine consistency
“The trend cards finally make my weekly numbers understandable.”
Trend clarity
“Clean design, reminders help me stay consistent every morning.”
Daily adherence
“I can capture quick context before cuff checks without extra gear.”
No wearable needed
“Hydration and stress tools make the BP habit easier to keep.”
Whole routine support
“Weekly review cards help me prep for doctor visits in minutes.”
Doctor prep
Review highlight
01 / 06“Simple BP logging flow and fast pulse checks in one place.”
Routine consistency
Why this app works
The main product promise is simple: track blood pressure every day without friction. Pulse, stress, and recovery tools are layered in to make that BP habit easier to keep.
Pulse checks take seconds, so you can keep the habit even on busy days.
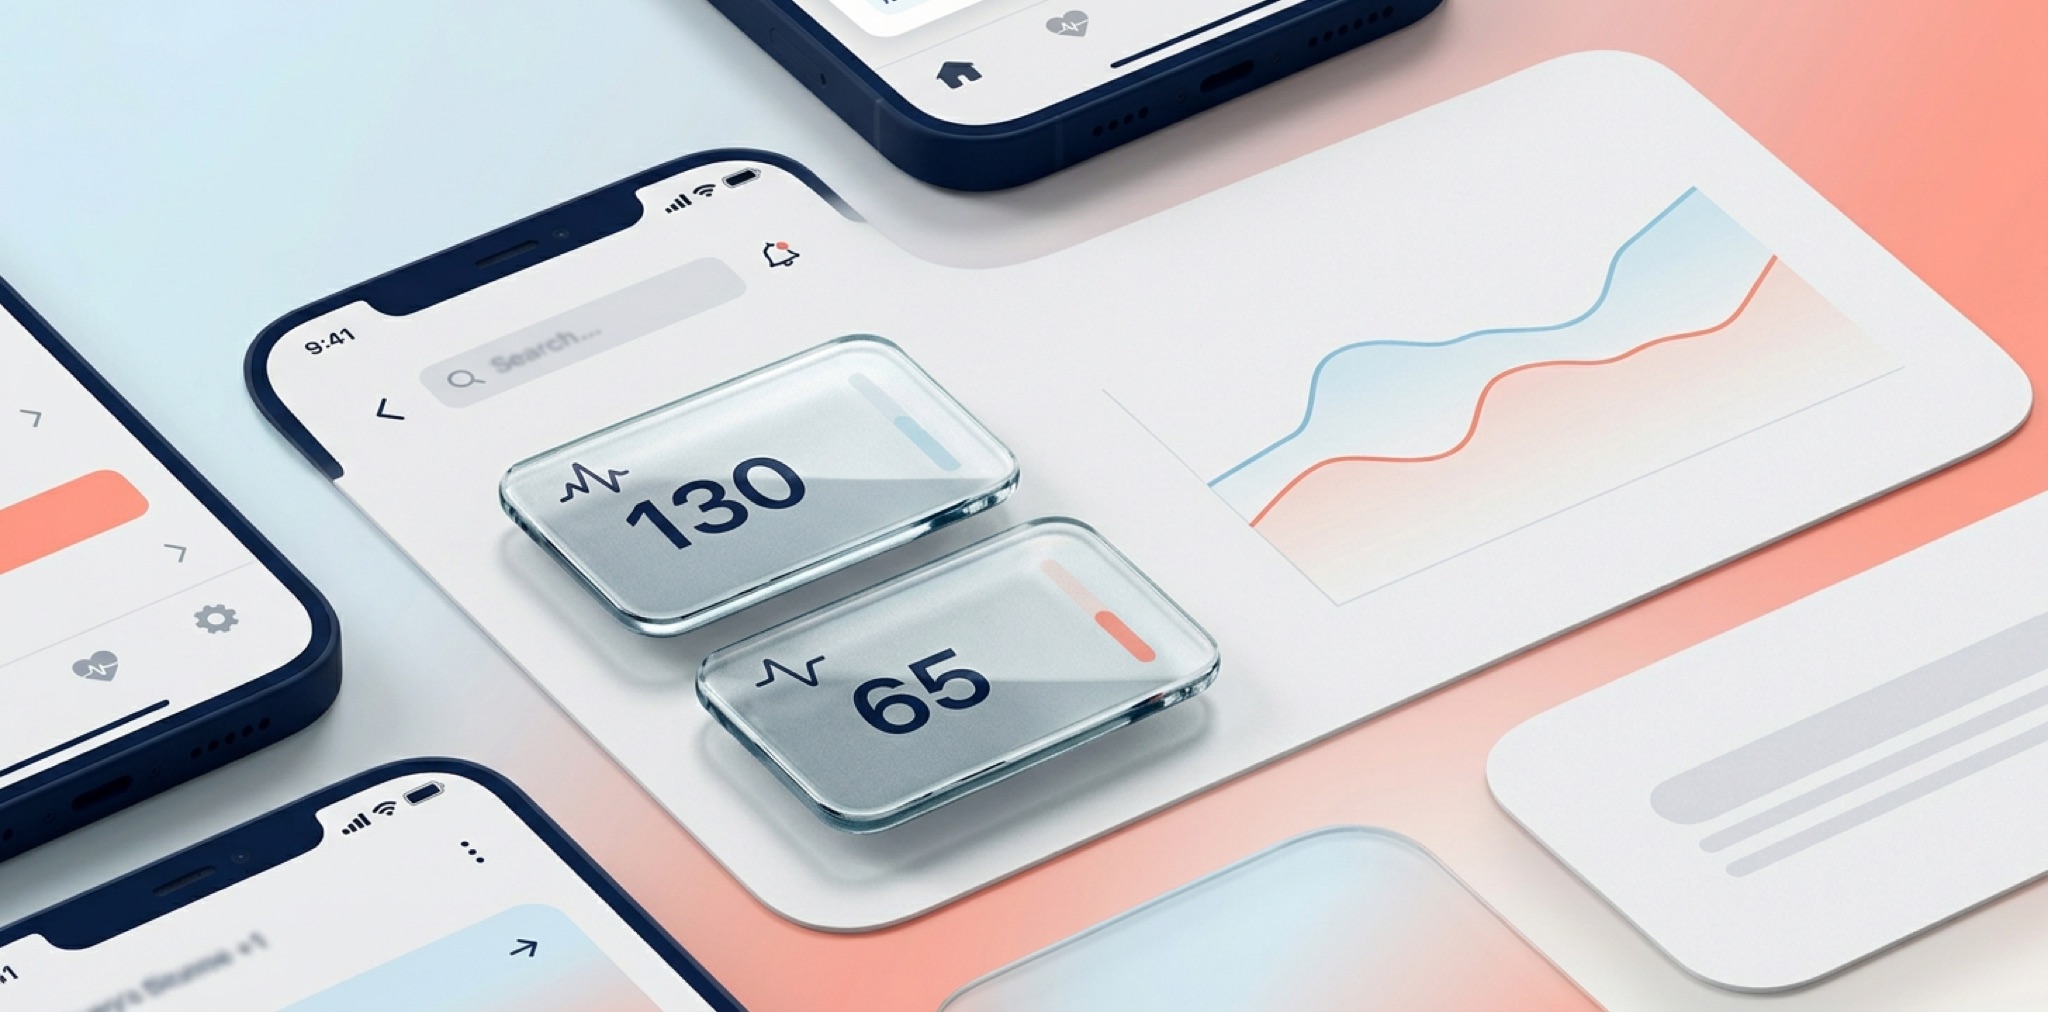
Move from single readings to weekly patterns that are easier to interpret.
Your wellness history is handled with on-device privacy-first principles.
Pulse, blood pressure logs, breathing, and hydration in one consistent workflow.
Feature stack
The product positioning is blood-pressure-first: logging and tracking are central, while pulse, stress, and wellness tools strengthen adherence.

In app: Blood tracker
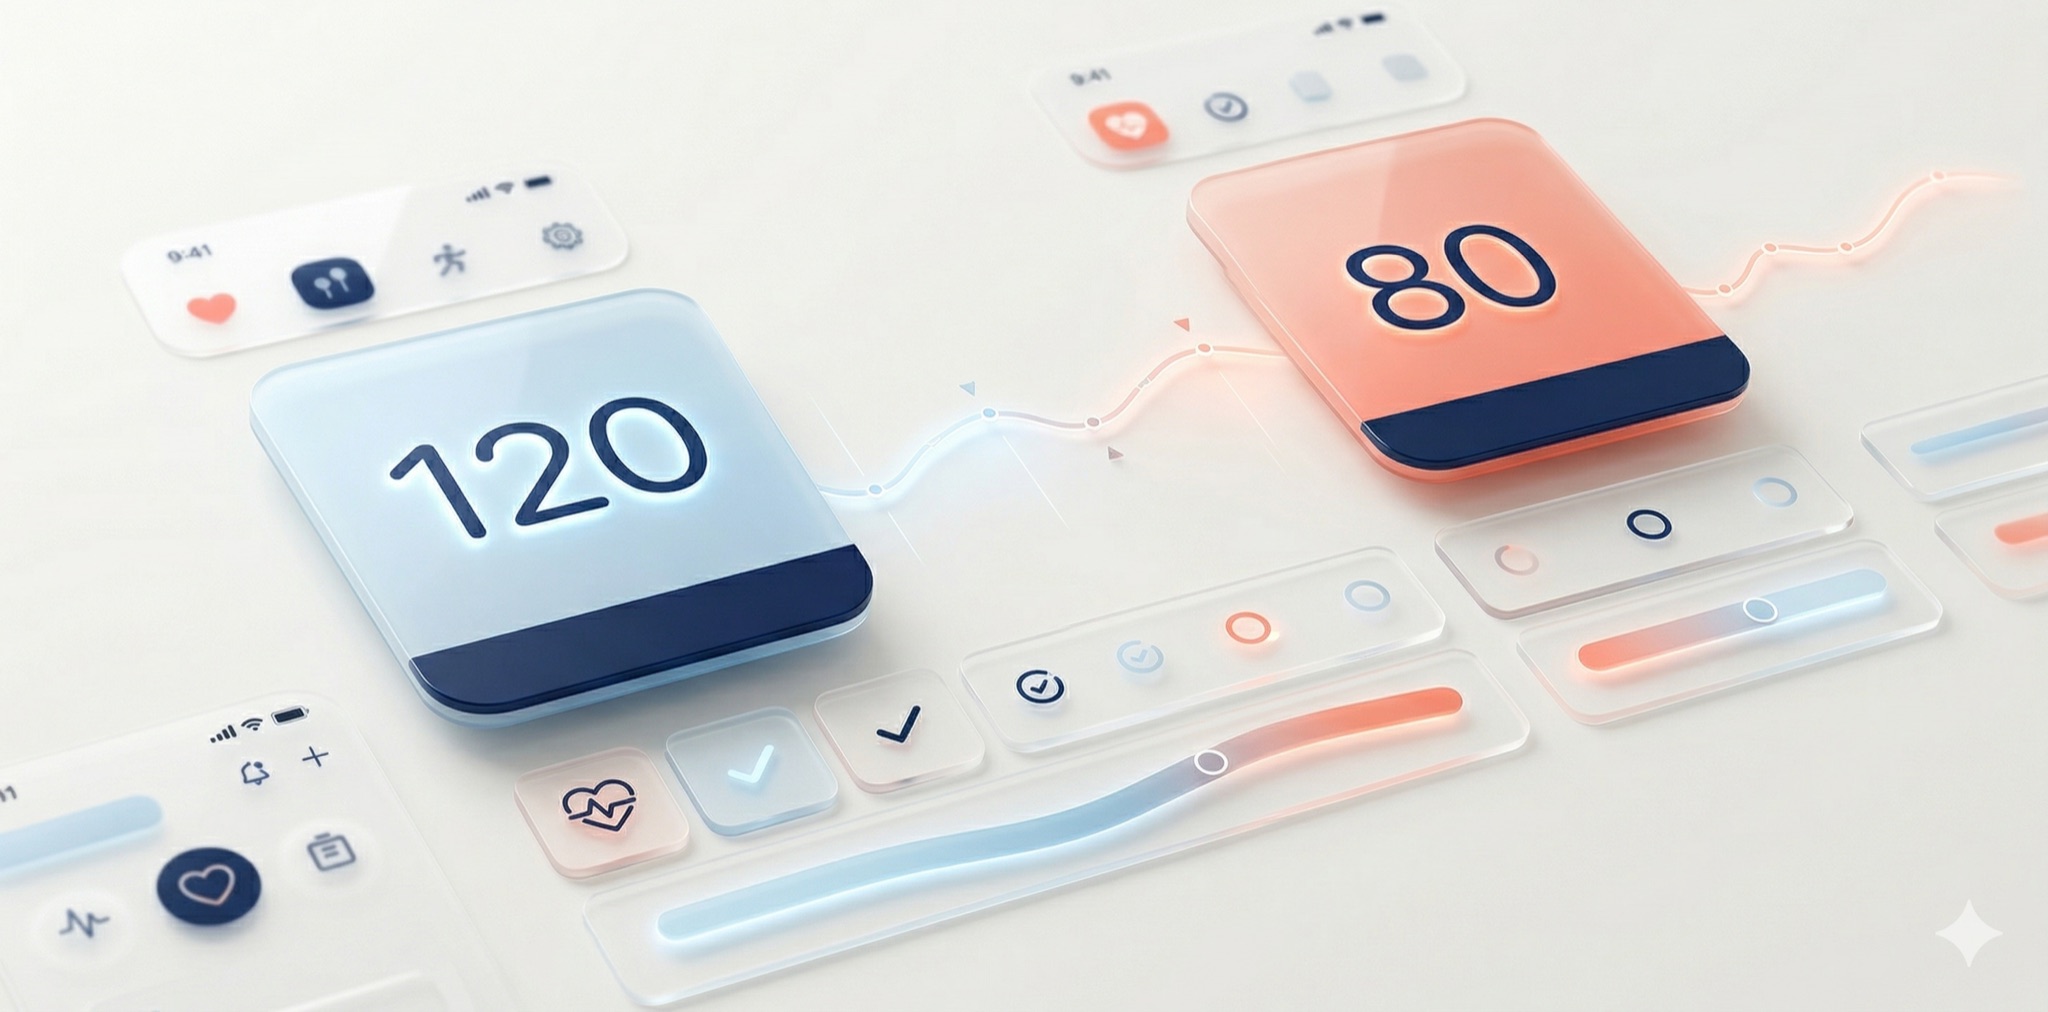
Log systolic and diastolic values, store your readings over time, and keep a consistent blood-pressure routine day after day.

In app: Pulse & Stress
Place a finger on the camera to estimate pulse and stress-related signals. Use it as a fast supporting metric around BP checks.
In app: Health Tracker
Review trend charts for key health metrics in one place so your blood pressure history has context, not isolated numbers.
What is included in the app
How it works
Blood pressure logging is the primary flow. Finger-on-camera pulse checks add quick context before and after readings.
The app checks contact quality and helps you hold the right pressure before measurement starts.
The camera and flash capture tiny blood-flow changes (PPG signal) and convert them into pulse insights.
You get immediate results plus history cards to compare today's reading with your weekly baseline.
Wellness disclaimer: pulse checks are informative and not a substitute for diagnosis, treatment, or urgent care.

Social proof
Review themes based on public App Store feedback: 4.7 / 5 rating.
Public App Store theme
“I finally stopped skipping my BP logs. The reminders plus quick pulse check make the routine realistic even on workdays.”
Summarized from public feedback themes, focused on habit clarity and everyday consistency.
SEO content engine
We answer high-intent questions users search before downloading a pulse or blood-pressure app.
A step-by-step checklist to improve the consistency of your home blood pressure logs and reduce noisy readings.
6 min read • Mar 3
What systolic and diastolic values represent, and how to read your week-level pattern more confidently.
5 min read • Mar 2
Small setup errors can shift BP results. Learn what to standardize before every check.
6 min read • Mar 1
FAQ
Measurement quality, safety boundaries, daily routines, and privacy explained in practical terms.
Can I really measure pulse by placing a finger on the camera?
Yes. The app uses photoplethysmography (PPG): the camera and flash detect subtle blood-flow changes in your fingertip to estimate pulse rate for wellness tracking.
How should I combine cuff blood pressure logs with camera pulse checks?
Use cuff readings as your primary blood pressure source, and pulse checks as supportive context before or after BP logging.
Why can pulse or BP-related numbers vary from one check to another?
Variation is normal. Physiology changes with stress, hydration, breathing, time of day, sleep, posture, and recent activity.
How often should I track blood pressure and pulse?
For most users, once or twice daily under consistent conditions provides enough signal to see useful patterns.
Is Blood Pressure a medical device or diagnostic tool?
No. The app is built for wellness awareness, habit support, and trend tracking; it does not diagnose, treat, or replace clinical care.
Do I need an Apple Watch or external sensor?
No wearable is required. You can run camera pulse checks on iPhone and manually log blood-pressure values from your cuff.
How is my health and measurement data handled?
The app follows privacy-first principles and is designed to keep your wellness tracking history under your control.
How should I interpret app trends without overreacting?
Look for direction and consistency over time. A weekly trend is more meaningful than a single check taken under unknown conditions.
Where can I download Blood Pressure?
The app is available on the Apple App Store. Use any “Download on the App Store” button on this landing page.
Contact
We usually reply within 1 business day. For urgent medical issues, contact a qualified healthcare service.
Questions about measurements, subscriptions, or account settings.
Email supportHealth content, strategic partnerships, and app collaborations.
Contact teamNeed product details, screenshots, or founder commentary.
Request media kitReady to install
Download Blood Pressure and start measuring pulse with your camera, logging blood pressure, and following a calmer routine from day one.
Wellness app. Not a medical diagnostic device.
Cookie preferences
We use essential cookies for core website functionality and optional analytics cookies to improve content. Learn more in our Cookie Policy.


